Estero, Lee County, Florida
WildBlue Market Report, September 2026
Live listings, every recent sale and a monthly reading of the WildBlue market, prepared from the MLS by Scott Schilling of Compass.
Median sale price, 12 months
$1.32M
−2.5% year over year
Homes sold, 12 months
65
−35% year over year
For sale today
30
8 under contract
Months of supply
5.5
Balanced
September 2026 report · data through October 18, 2026 · next report November 15
The September 2026 report
What happened in WildBlue this month
4 WildBlue homes closed in September 2026, the same number as a year earlier, at a median price of $1,260,000. With so few sales in one month, a single home can move the median a long way, so the 12 month figures below are the better guide to value.
Over the last 12 months, 65 homes sold for a combined $95.8M, fewer than the 100 sales the year before. Values held up better than the sales count suggests: the median price per square foot is $510, up 7.1% from $476, while the median sale price of $1,325,000 is down 2.5%. When price per square foot rises while the median price eases, the mix of homes selling has shifted toward smaller homes rather than prices falling.
Today there are 30 homes for sale and 8 under contract. At the current pace that is 5.5 months of supply, which reads as a balanced market. Sellers are closing at a median 95.6% of their final asking price after 66 days on market, compared with 94.6% and 53 days a year ago. 9 of the 30 active listings have been on the market for more than 120 days, a reminder that pricing still decides how fast a home sells.
The market is not the same at every price. For homes between $2M and $3M there are 2.8 months of supply, while homes between $1.5M and $2M have 11 months, so a seller in that range is competing with more choice for buyers.
For homeowners: Homes priced in line with recent sales are selling, while those priced ahead of the market are waiting. For buyers, the price band and street matter more than the community average, which is why the tables below break the numbers down.
Key figures
| Measure | September 2026 | Same month last year | Last 12 months | Prior 12 months | Change |
|---|---|---|---|---|---|
| Closed sales | 4 | 4 | 65 | 100 | −35% |
| Sales volume | $5.41M | $6.95M | $95.8M | $153.8M | −37.7% |
| Median sale price | $1,260,000 | $1,825,000 | $1,325,000 | $1,359,200 | −2.5% |
| Average sale price | $1,351,250 | $1,737,500 | $1,474,566 | $1,538,458 | −4.2% |
| Median price per sq ft | $516 | $527 | $510 | $476 | +7.1% |
| Average price per sq ft | $477 | $541 | $524 | $509 | +2.9% |
| Median days on market | 80 | 92 | 66 | 53 | +24.5% |
| Average days on market | 88 | 100 | 80 | 75 | |
| Sale to final list price | 95.3% | 93.8% | 95.6% | 94.6% | |
| Highest sale | $1,700,000 | $2,100,000 | $4,278,500 | $5,475,000 | |
| Lowest sale | $1,185,000 | $1,200,000 | $630,000 | $600,000 |
Active listings
30
median ask $1.52M
Pending sales
8
median ask $1.6M
Months of supply
5.5
active ÷ monthly sales pace
Absorption
18.1%
of active homes selling per month
Asking price per sq ft
$513
vs $510 sold
Single month figures rest on 4 sales and can swing widely. Percentage changes are shown only for 12 month periods, where the sample is large enough to compare.
Trends
How the market has moved
Year by year
| Year | Closed sales | Of which builder closings | Volume | Median price | Median per sq ft | Median days |
|---|---|---|---|---|---|---|
| 2023 | 146 | 22 | $220.6M | $1,349,500 | $482 | 34 |
| 2024 | 96 | 16 | $142.7M | $1,320,000 | $478 | 47 |
| 2025 | 85 | 4 | $133.6M | $1,400,000 | $478 | 61 |
| 2026 through September | 55 | 3 | $81M | $1,325,000 | $509 | 66 |
Builder closings are new homes recorded in the MLS after the sale without being marketed there. Their share fell from 15% of sales in 2023 to 4.6% in the last 12 months, so WildBlue is now almost entirely a resale market. That shift explains part of the drop in sales counts.
Value explorer
The market by price, neighborhood and street
| Price range | Sold, 12 months | Median price | Per sq ft | Sale to list | Median days | For sale now | Pending | Months of supply |
|---|---|---|---|---|---|---|---|---|
| Under $1M | 18 | $829,950 | $366 | 96.7% | 85 | 8 | 1 | 5.3 |
| $1M to $1.5M | 21 | $1,268,000 | $509 | 94.5% | 65 | 7 | 3 | 4 |
| $1.5M to $2M | 12 | $1,767,500 | $560 | 94.8% | 46 | 11 | 3 | 11 |
| $2M to $3M | 13 | $2,200,000 | $724 | 93.8% | 57 | 3 | 0 | 2.8 |
| $3M and up | 1 | $4,278,500 | $951 | 95.2% | 380 | 1 | 1 | 12* |
* Fewer than 5 sales in 12 months, so the supply figure is not reliable.
Vista WildBlue
Blue Bay Circle and Indigo Blue Court
- Sold, 12 months
- 30
- Median price
- $1,182,000
- Per sq ft
- $480
- Sale to list
- 96.7%
- Median days
- 66
- Range
- $760,000 to $1.8M
WildBlue
Aqua Shore, Blue Sapphire, WildBlue Boulevard, Blue Eye Loop and nearby streets
- Sold, 12 months
- 35
- Median price
- $1,790,000
- Per sq ft
- $559
- Sale to list
- 94.9%
- Median days
- 66
- Range
- $630,000 to $4.28M
Neighborhoods follow the MLS subdivision field: Vista WildBlue is recorded as its own subdivision; every other street is recorded as WildBlue.
| Street | Sold, 36 months | Median price | Per sq ft | Median days | Range |
|---|---|---|---|---|---|
| Blue Bay Circle | 106 | $1,047,500 | $432 | 42 | $600,000 to $1.85M |
| WildBlue Boulevard | 53 | $1,790,000 | $578 | 66 | $1.32M to $2.6M |
| Blue Sapphire Drive | 52 | $1,564,500 | $519 | 62 | $1.18M to $3M |
| Aqua Shore Drive | 26 | $1,269,000 | $466 | 62 | $740,000 to $1.8M |
| Blue Eye Loop | 14 | $4,289,250 | $944 | 78 | $3.3M to $5.47M |
| Aqua View Lane | 9 | $975,000 | $375 | 52 | $645,000 to $1.46M |
| Marquesa Drive | 6 | $867,500 | $361 | 68 | $630,000 to $1.4M |
| Aqua Reserve Court | 3 | $834,900 | $321 | 85 | $665,000 to $862,000 |
Streets with fewer than 3 sales in 36 months are left out to protect privacy and avoid misleading medians.
For sale now
WildBlue homes for sale
Every active WildBlue listing in the MLS, updated automatically. Use the filters to narrow by price, bedrooms or home type, and open any home for photos and details.
Recently sold
What homes are actually selling for
The latest closings, with the final asking price beside the price paid. 95.6% is the typical result over the last year.
| Closed | Street | Beds/Baths | Sq ft | Asking | Sold | Sold vs asking | Days |
|---|---|---|---|---|---|---|---|
| Sep 25, 2026 | WildBlue Boulevard | 4/3 | 2,966 | $1,799,000 | $1,700,000 | 94.5% | 79 |
| Sep 23, 2026 | Blue Bay Circle | 3+den/3 | 2,445 | $1,299,000 | $1,280,000 | 98.5% | 62 |
| Sep 22, 2026 | Aqua View Lane | 4+den/4 | 3,936 | $1,269,500 | $1,185,000 | 93.3% | 132 |
| Sep 14, 2026 | Blue Bay Circle | 3+den/3 | 2,434 | $1,289,000 | $1,240,000 | 96.2% | 80 |
| Aug 31, 2026 | Aqua View Lane | 3+den/3 | 2,258 | $989,000 | $975,000 | 98.6% | 20 |
| Aug 26, 2026 | Blue Bay Circle | 3+den/3 | 2,445 | $1,199,000 | $1,100,000 | 91.7% | 97 |
| Aug 17, 2026 | Blue Bay Circle | 4/3 | 2,247 | $929,000 | $895,000 | 96.3% | 76 |
| Aug 14, 2026 | Blue Bay Circle | 3+den/3 | 2,445 | $1,435,000 | $1,435,000 | builder sale | n/a |
| Aug 13, 2026 | Aqua Reserve Court | 4/4 | 3,553 | $940,000 | $862,000 | 91.7% | 85 |
| Aug 7, 2026 | Blue Bay Circle | 4/3 | 2,801 | $1,649,000 | $1,550,000 | 94% | 163 |
| Jul 22, 2026 | Blue Sapphire Drive | 4/4 | 3,178 | $1,895,000 | $1,760,000 | 92.9% | 94 |
| Jul 15, 2026 | Blue Bay Circle | 2+den/2 | 1,891 | $779,500 | $760,000 | 97.5% | 66 |
For homeowners
What is your WildBlue home worth?
Over the last 12 months WildBlue homes sold for a median $510 per square foot, but the median varies by as much as $512 per square foot from one street to another. Scott will compare your home with the closest recent sales on your street and in your price range, and send you a written value range. No obligation.
Monthly report
Get the WildBlue report on the 15th
One email a month with the latest sales, prices and supply in WildBlue. Past reports stay available here.
- September 2026 (this report)
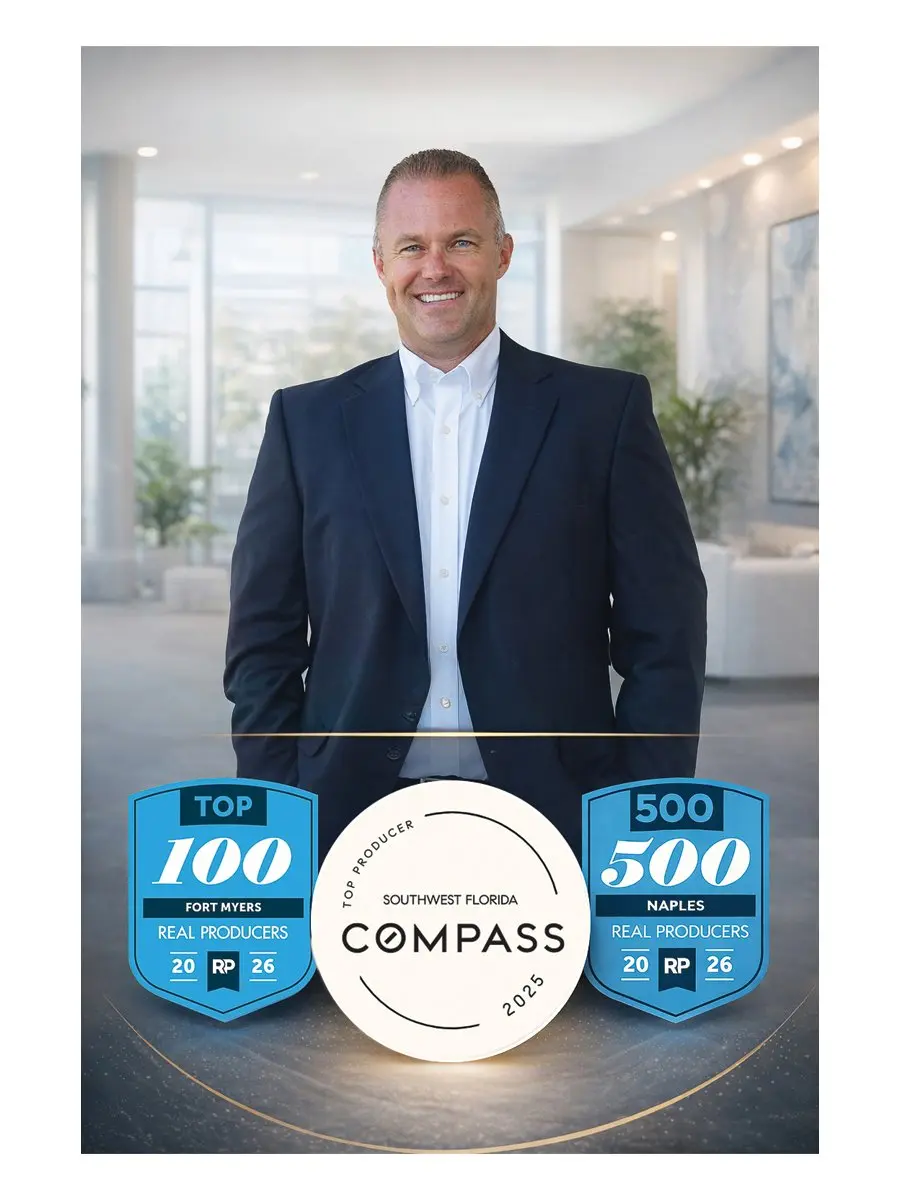
Your WildBlue specialist
Scott Schilling
Real Estate Agent, Compass
- $5.475MHighest WildBlue sale recorded in the MLS since October 2022, a Stock custom home on Blue Eye Loop that Scott closed in January 2025SWFL MLS, Oct 2022 to Oct 2026
- #1WildBlue agent for sales of $2M and up, past 12 monthsSWFL MLS, Oct 2025 to Oct 2026
- #2WildBlue agent by sales volume, past 12 monthsSWFL MLS, Oct 2025 to Oct 2026
Buying or selling in WildBlue?
Sources and method
Market figures come from the Southwest Florida MLS (Matrix), searching Residential, Development Name = WILDBLUE, pulled October 18, 2026. They include every closed sale recorded in the MLS, including new homes entered by builders after closing. Days on market and sale to list ratios use MLS marketed sales only. Sale to list compares the sale price with the final asking price. Months of supply divides today's active listings by the average monthly sales of the last 12 months. Rolling 3 month figures smooth out months with very few sales. Duplicate MLS numbers, missing prices and implausible values are removed before any calculation.
Community facts are cited to their sources below. Where sources disagree, the more conservative figure is shown.